Reading the Blockchain's Pulse: How On-Chain Metrics Reveal Market Turning Points Before Prices Move

In traditional financial markets, analysts pore over earnings reports, Federal Reserve statements, and macroeconomic indicators to anticipate where prices are heading. Cryptocurrency markets offer something those legacy systems never could: a fully transparent, immutable ledger of every transaction ever executed. That ledger — the blockchain itself — is a living data source, and the investors who know how to interpret it hold a distinct informational edge.
At DochCoin, we believe that understanding on-chain analytics is no longer optional for serious market participants. It is fast becoming a foundational skill, much like reading a balance sheet once was for equity investors.
Why Price Alone Is an Incomplete Signal
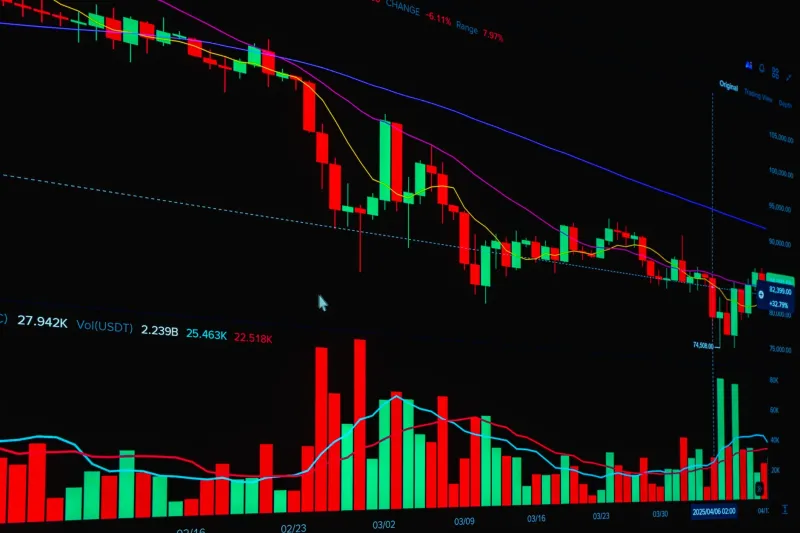
Most retail investors fixate on price. They watch candlestick charts, track moving averages, and react to headlines. While technical analysis has its place, price is ultimately a lagging indicator — it reflects decisions that have already been made, capital that has already moved. By the time a trend is obvious on a price chart, the sharpest opportunities have frequently passed.
On-chain data operates differently. It captures the underlying behavior of network participants: how many wallets are active, where coins are being transferred, and whether large holders are accumulating or distributing. These behavioral patterns often precede significant price movements by days, weeks, or even months.
Whale Watching: Tracking Large Wallet Movements
Few signals carry as much weight as the movement of so-called "whales" — wallets holding substantial quantities of a given cryptocurrency. When these addresses begin shifting large sums to centralized exchanges, it frequently signals preparation for a sell event. Conversely, when exchange balances decline as coins migrate to cold storage or self-custody wallets, it often indicates accumulation behavior consistent with longer-term holding intent.
Platforms such as Glassnode, Nansen, and CryptoQuant provide dashboards specifically designed to track these large-holder movements. The "Exchange Whale Ratio," for instance, measures the proportion of exchange inflows attributable to the top ten largest transactions at any given time. Elevated readings on this metric have historically preceded periods of elevated selling pressure — a useful early warning for investors managing downside risk.
For US-based investors navigating volatile market conditions, monitoring these signals can provide critical context that pure price analysis simply cannot offer.
Exchange Inflows and Outflows: Following the Capital Trail
One of the most reliable on-chain frameworks involves tracking the net movement of assets to and from centralized exchanges. The logic is straightforward: coins moving onto exchanges are typically being prepared for sale, while coins leaving exchanges suggest investors intend to hold rather than liquidate.
During the final stages of a bull market, exchange inflows tend to spike dramatically as participants rush to capture profits. During bear market bottoms, the opposite pattern frequently emerges — long-term holders quietly withdraw their assets from exchanges, reducing the available supply and setting the stage for the next appreciation cycle.
The "Exchange Net Position Change" metric, available through several on-chain analytics providers, quantifies this flow on a rolling basis. When this metric turns sharply negative — meaning more coins are leaving exchanges than arriving — historically it has coincided with periods of price stabilization and eventual recovery.
Network Activity and the Health of the Ecosystem
Beyond individual wallet behavior, the aggregate health of a blockchain network communicates meaningful information about market sentiment and adoption trends. Active address counts, transaction volumes, and fee levels all serve as proxies for genuine network utilization.
A network experiencing rising active addresses alongside stagnant or declining prices presents a compelling divergence. It suggests that real users are engaging with the protocol even as market sentiment remains pessimistic — often a precursor to renewed price discovery. Conversely, a network where prices are climbing but active addresses are flat or declining may be experiencing speculative froth rather than organic growth, a pattern associated with unsustainable rallies.
The "Network Value to Transactions" ratio, commonly abbreviated as NVT, applies a valuation lens to this data. By comparing a network's market capitalization against its on-chain transaction volume, analysts can assess whether current prices are justified by actual economic activity. An elevated NVT ratio suggests the market may be pricing in growth that has not yet materialized — a potential indicator of overvaluation.
The MVRV Ratio: Gauging Market Sentiment at Scale
Among the most widely respected on-chain valuation tools is the Market Value to Realized Value ratio, or MVRV. Realized Value calculates the aggregate cost basis of all coins in circulation by assigning each coin the price at which it last moved on-chain. When Market Value — the current market capitalization — significantly exceeds Realized Value, it indicates that the average holder is sitting on substantial unrealized gains. History suggests these periods of elevated MVRV correspond with market cycle peaks.
When MVRV falls below 1.0, the market is priced below its aggregate cost basis, meaning the average holder is underwater. These conditions have historically marked generational buying opportunities — moments when capitulation has run its course and the market is poised for recovery. For disciplined US investors willing to act on data rather than emotion, MVRV can serve as a powerful compass during periods of extreme uncertainty.
Combining Metrics for a Comprehensive View
No single on-chain metric tells the complete story. The most effective analysts treat these tools as complementary instruments in a broader diagnostic framework — much like a physician reviewing multiple test results before arriving at a diagnosis.
A compelling bullish setup, for example, might combine declining exchange balances, rising active addresses, an NVT ratio trending downward, and an MVRV reading near or below 1.0. Each data point reinforces the others, building a case grounded in observable behavior rather than speculation.
Equally important is understanding the limitations of on-chain data. Metrics can be distorted by exchange internal transfers, wash trading activity, and the behavior of custodial platforms that batch transactions. Experienced analysts apply filters and cross-reference multiple sources before drawing conclusions.
Building Your On-Chain Toolkit
For investors ready to incorporate these methods into their research process, several platforms offer accessible entry points. Glassnode and CryptoQuant provide professional-grade dashboards with extensive metric libraries. IntoTheBlock offers simplified visualizations suited to those newer to on-chain analysis. Many of these platforms provide free tiers with meaningful functionality, making them accessible to individual investors without institutional resources.
The learning curve is real, but the payoff is substantial. In a market where information asymmetry remains significant, developing fluency in on-chain analytics can meaningfully differentiate your decision-making from the crowd.
The Bottom Line
The blockchain does not lie. Every transaction, every wallet movement, every fee paid is recorded permanently and available for analysis. For investors willing to look beyond price charts and engage with this deeper layer of market intelligence, the rewards can be considerable.
At DochCoin, we remain committed to equipping our readers with the analytical frameworks needed to navigate crypto markets with greater confidence and precision. On-chain metrics represent one of the most powerful tools available to the modern digital asset investor — and understanding them may well be the edge that separates informed participants from those perpetually reacting to yesterday's news.